By World War II, radar had become an essential tool used by every modern military to detect incoming enemy aircraft. Operators had long noticed that radar systems returned strange echoes during inclement weather, and it was soon discovered that these anomalous signals were actually signatures of precipitation itself. After all, radar is based on a simple principle; send radio waves out into the ether, and listen for anything that bounces back. Water droplets and ice crystals en masse are more than capable of reflecting radio waves, and this presented a new use for the technology. In 1942, the U.S. Navy donated 25 radar systems to the National Weather Service, and the first weather radar system was born.
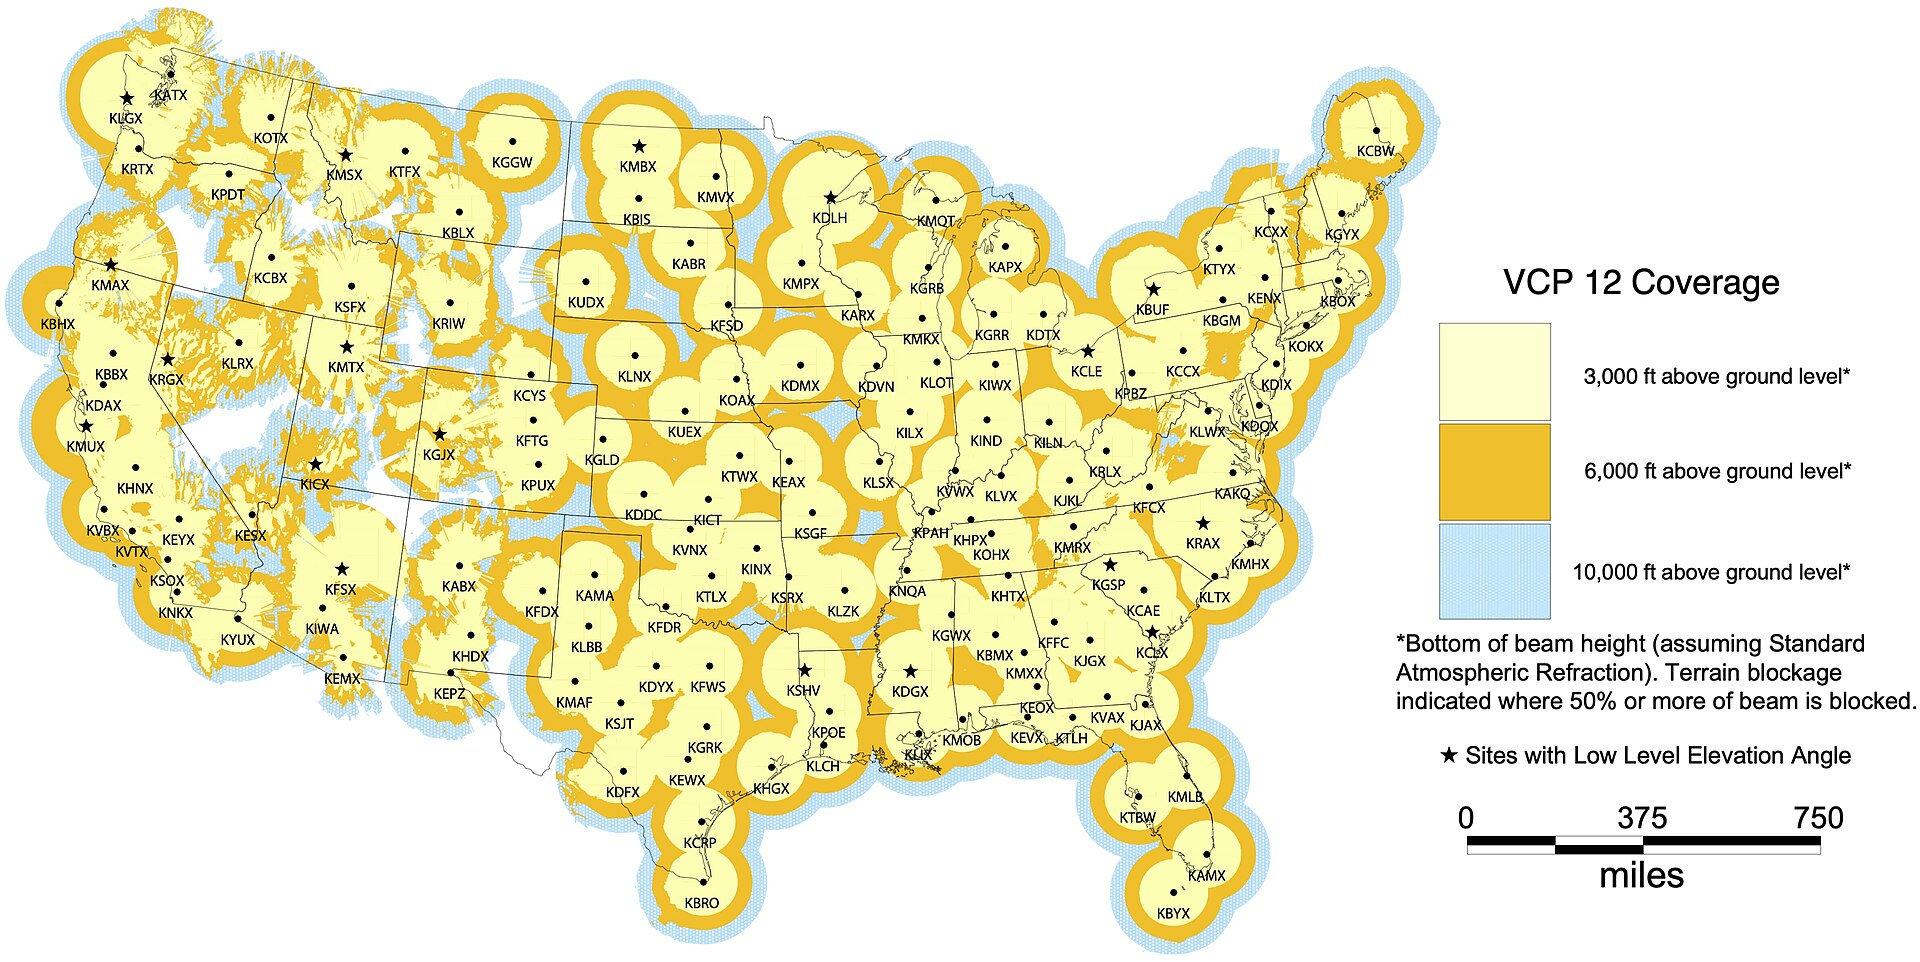
Weather radar was immediately impactful as it provided the first remote monitoring system for tracking severe thunderstorms capable of wind damage, hail, and generating tornadoes. These storms are often discrete, localized, and difficult to forecast from meteorological conditions alone. While synoptic patterns can indicate favorable conditions for thunderstorms, actual cell initiation is stochastic and unpredictable. Severe thunderstorm and tornado warnings are issued primarily based on NEXRAD, the current weather radar network. Relying on a single data mode can be problematic, though. Planned and unplanned service outages do occur, and the coverage famously has holes. The range of a radar system is limited by diminishing signal strength and the curvature of the earth; it cannot detect storms that are below the horizon. A recent Washington Post article discussed the impact of radar coverage gaps extensively. Ultimately, there is considerable motivation to investigate whether radar signals could be predicted or simulated from other data sources (such as satellite imagery), providing both a back-up in case of outages and a synthetic product to help patch holes in the coverage.
Storm EVent ImageRy (SEVIR) Project
The Storm EVent ImageRy (SEVIR) project provides exactly the type of dataset I need to test this idea. In fact, in this case the existence of this data inspired the project. SEVIR is a machine learning ready dataset containing cropped, annotated, and geospatially aligned doppler radar and satellite imagery for both severe weather storm events and randomly selected areas and times. The satellite imagery comes from the GOES-16 system and includes a visible band (VIS), two infrared bands showing water vapor and brightness temperature (IR 6.9 and IR 10.7), and lightning strikes. Most of these terms are self explanatory, but brightness temperature may be unfamiliar. In basic terms, this can be thought of a representation of the height of the cloud tops: the higher the cloud top, the colder the temperature. A classic characteristic of a supercell thunderstorm is an overshooting top, where convective updrafts have enough momentum to pass through the equilibrium level (the altitude where convective forces are neutral). Therefore, thunderstorms with deeply cold brightness temperatures are likely to be severe.
Looking at the example imagery above, the prediction problem is intuitively clear. Given the 4 matched GOES imagery channels, can the radar image (labeled as Vertically Integrated Liquid) be predicted? One could imagine a practical application of synthesizing radar imagery to patch coverage holes or cover outages from satellite data, which is nearly real time. The patterns are visually apparent: precipitation is correlated to areas with visual clouds, high water vapor, low brightness temperature, and lightning strikes. However, the correlation is not very strong at the pixel level - there are deeper patterns that present an opportunity for neural networks to shine here. For example, notice how the high level winds blow the tops of the clouds quickly to the east in the example above, while the precipitation remains more stationary. A successful model will learn these types of patterns for a more accurate synthetic radar image.
Model Choices and Performance
Three models of increasing complexity were chosen for training and evaluation. This helps portray the limitations of the information content in the data, since simpler models with fewer trainable parameters are useful for understanding the basic relationships and patterns in the data. The models were:
1) Linear model: the simplest possible model is a pixel predicting linear regression. The model regresses pixels in the satellite imagery channels on pixels in the radar imagery. This model has 5 trainable parameters: 4 coefficients (one per GOES channel) and an intercept. Individual pixels in the output only depend on information in the corresponding input pixel.
2) ConvNet: the next step up is a single convolutional layer that determines output pixels from a k by k grid of nearest-neighbor input pixels, where k is the kernel size. I chose a kernel of 7, giving 49 trainable parameters. In this model, nearby information can influence output pixels, which can be especially helpful with lightning strikes.
3) UNet: the most complex model was an implementation of the UNet architecture published by Olaf Ronneberger, Philipp Fischer, and Thomas Brox in 20151. This is a fully convolutional multilayer network with a contracting-upsampling design, where the upsampling layers directly incorporate high-resolution information from the contracting outputs. This network design has shown good performance in image segmentation tasks, as it is able to leverage the context of the entire image in the predictive output.
All three models were trained on batches of SEVIR data, using the dataloader provided in the SEVIR repository. The notebook used for training and configuration can be found here.
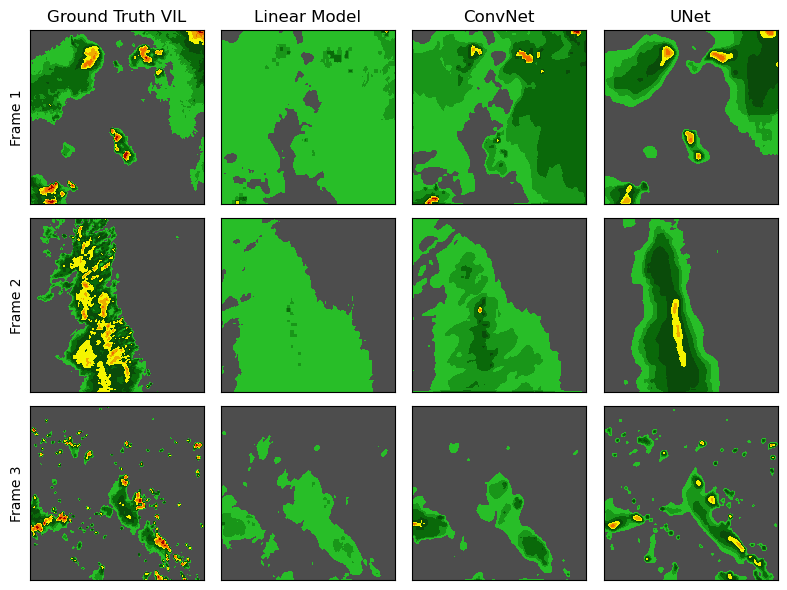
Examining the loss (mean squared error) for each model would tell you that the more complex models performed better on average, but in this case, it can be more informative to examine some actual predictions (shown above). The linear model captures some of the general shapes, but ultimately fails to achieve good accuracy. The ConvNet model improves on the linear model, especially in terms of high precipitation areas. However, the shapes of the precipitation areas are still not accurate, and they are similar to the linear model. This shows that more than the local area is needed for good accuracy. The UNet model is by far the best, and is able to capture global shapes and local details well. It seems that the task of determining what cloudy areas on radar actually result in rain is tractable, even for areas with no lightning strikes.
The gif above shows an example storm sequence with the predicted and ground truth radar imagery (VIL) for the UNet model. While the performance is good, some artifacts are apparent where precipitation areas appear and disappear between frames. The models tested here do not incorporate the temporal structure of the data, which could help improve performance. The UNet could be modified with a recurrent scheme to help use previous predicted frames and previous satellite data, which would further improve the depth of pattern recognition.
Conclusions
I showed that weather radar imagery can be synthesized by training image segmentation models on the SEVIR dataset, which has been curated for machine learning analysis of weather imagery. The model is able to learn deeper relationships between these imagery types that presumably connect to typical storm structures, and go beyond single-pixel level analysis. Composite radar products, if not using these techniques already, could improve the imagery for radar deficient areas. Model architecture could be further improved by incorporating temporal information, which would help stabilize the precipitation patterns in sequenced frame generation. Overall, the proof of concept was successful in showing that radar imagery can be recapitulated from satellite imagery alone with reasonable fidelity, and the resulting synthetic radar could aid in near-term forecast accuracy.
Code
The notebook and associated files used to create and train the models can be found at: https://github.com/rlang81/blog/tree/main/sevir
References
-
Ronneberger, O., Fischer, P., & Brox, T. (2015). U-net: Convolutional networks for biomedical image segmentation. In Medical image computing and computer-assisted intervention–MICCAI 2015: 18th international conference, Munich, Germany, October 5-9, 2015, proceedings, part III 18 (pp. 234-241). Springer International Publishing. ↩