Fitbit announced in August of 2020 that it would be activating the Estimated Oxygen Variation (EOV) graph feature for tracking blood oxygen saturation changes during sleep. For several years, Fitbit and other smartwatches had been equipped with red and near-infrared (NIR) LEDs and photodetectors to measure blood oxygenation at the wrist. Tissue illuminated with both red and NIR light will scatter some of both wavelengths back to the origin, where they can be detected. The ratio of red to NIR scattering is well known to be dependent on hemoglobin oxygenation: as oxygenation decreases, more NIR light and less red light will be scattered back to the sensor.
The primary purpose for smartwatches to detect oxygen saturation (SpO2) changes was to enable detection of apnea and hypopnea events during sleep. Apneas are defined as complete pauses of breathing for 10 seconds, while hypopneas are defined as ≥30% drop in airflow for ≥10 seconds, accompanied by an arousal or drop of SpO2 of ≥3% at the fingertip1. Together, the number of both events per hour forms the Apnea-Hypopnea index, or AHI. An AHI ≥ 5 carries a diagnosis of at least mild Sleep Apnea, and it’s important to get treatment to avoid serious health effects.
However, the EOV feature had only a vague description from Fitbit, conveying that frequent, high variations could be a sign of Sleep Apnea. For me, EOV in general generated more questions than answers. Why not just show the standard SpO2 instead? And what is actually being graphed on the EOV plot? The language “variation” suggests that the line graph relates to the first derivative over time of blood oxygenation. Finally, the meaning of “frequent” is ambiguous at best. If I see the occasional orange spike in the graph, do I need to worry? To answer this, I downloaded a full archive of my Fitbit data and dove in.
Deciphering Estimated Oxygen Variation
Fitbit allows users to download the full raw data set associated to their account. For this project, the relevant data are a set of .csv files named “estimated_oxygen_variation-YYYY-MM-DD”, containing one days worth of EOV data. The reading is actually called “Infrared to Red Signal Ratio” and is recorded once per minute. Values appear to be unitless and range from -100 to 100, and appear quite noisy when plotted as a time series.
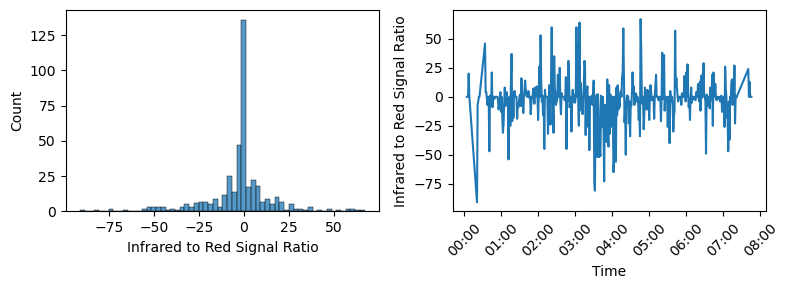
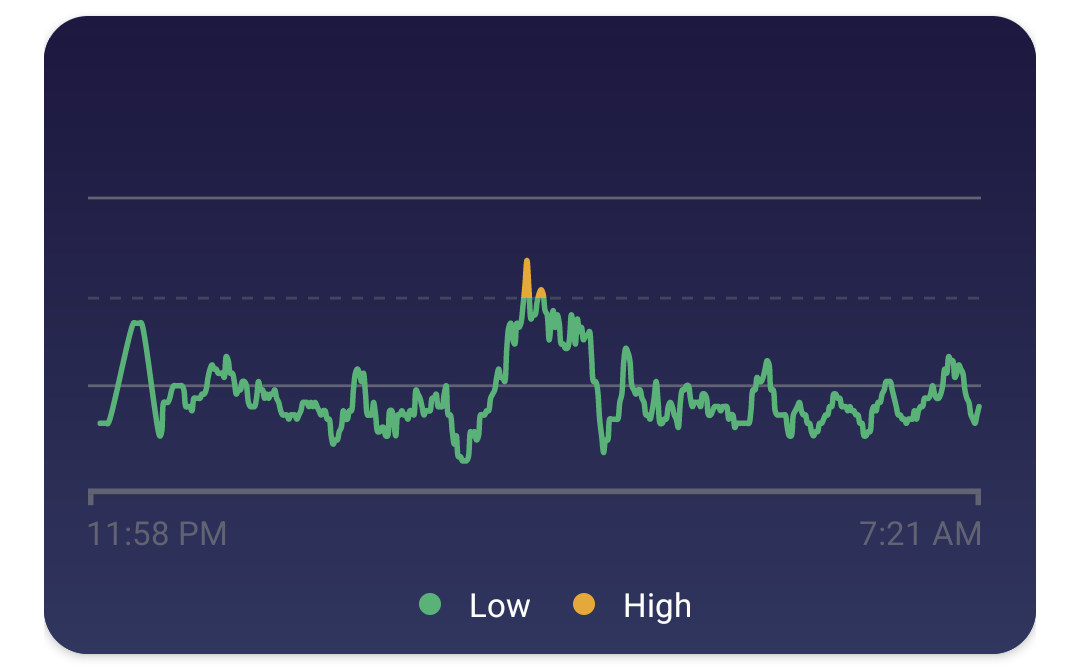
The label “Infrared to Red Signal Ratio” implies that this data should correlate directly to blood oxygen saturation. The values are confusing, since the range of values doesn’t look like a typical ratio of two signals. It’s likely that what’s actually reported here is a normalized and transformed version of the ratio. Presumably, the sensor calibrates itself during waking hours when SpO2 can be assumed to be normal. To transform the raw data into a plot that looks like Fitbit’s EOV, I inverted the data*, took a rolling average of 10 time steps, and shaded sections higher than 25 in orange. After adding a dashed line at y=25 and a solid line at y=5, I seemed to be fairly close to the EOV plot shown in the app.
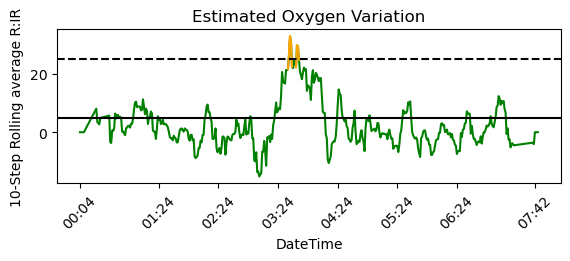
To summarize, “high variations” (orange spikes) that means that a ~10-minute average of the Infrared to Red signal ratio was below -25. The EOV graph corresponds to the inverse of SpO2; a high variation means lower SpO2, not a large change in SpO2 (i.e. either a positive or negative change).
*I’m not worried about the sign of the data here, since the signals likely originate from a photodetector voltage which may be positive or negative.
Aggregate Statistics
With the raw data for 10 months of sleep data available, it was relatively straightforward to generate some statistics that aren’t available in the Fitbit app. I set up a quick method to find EOV spikes and the length of time spent in high variations using the data processing outlined above:
EOV_df = pd.read_csv(file)
EOV_df['EOV'] = -EOV_df['Infrared to Red Signal Ratio'].rolling(rolling_tstep, center=True).mean().fillna(0)
EOV_df['EOV_high'] = np.where(EOV_df['EOV'] > 25, True, False)

Num_Spikes = (EOV_df['EOV_high'] & (EOV_df['EOV_high'] != EOV_df['EOV_high'].shift(1))).sum()
Min_High = EOV_df['EOV_high'].value_counts()[True]
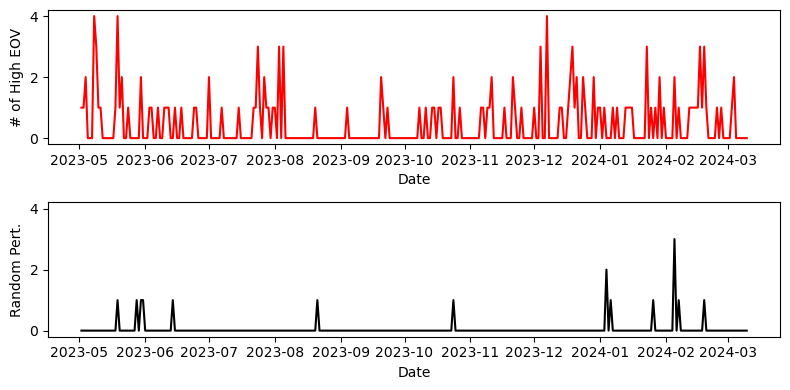
Fitbit suggests that frequent high variations could be a cause for concern; now we have a way to calculate the frequency. The number of high variation spikes per night was fit to a Poisson distribution. It may also be relevant to find the number of minutes spent in a high variation zone per night. Until further guidance is provided, it’s up to the user to judge the data for themselves.
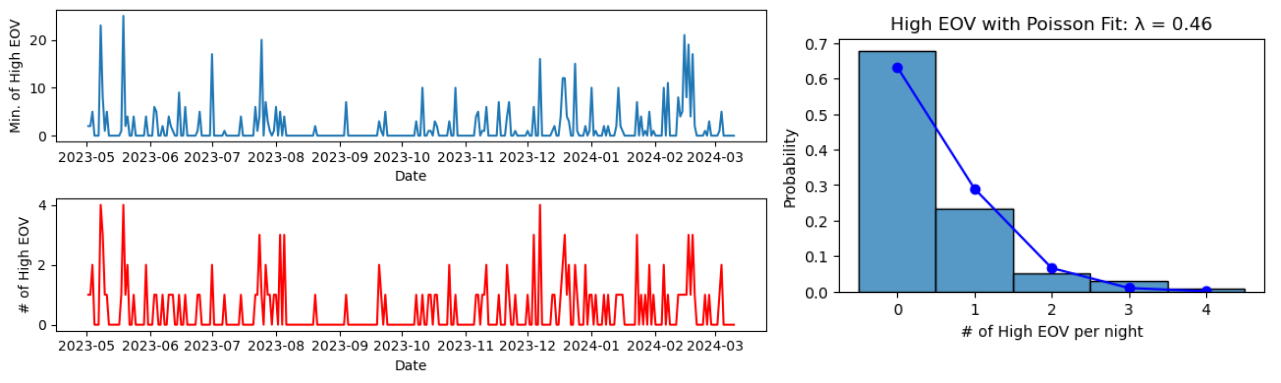
Given the noisy nature of the data, we can verify that the high EOV spikes arise from real structure in the data. One intuitive way to do this is to randomly permute the time series data, and re-compute the number of spikes. Doing this clearly decreases the number of spikes, indicating that most of them arise from real structured signal rather than just large fluctuations that happen to hit an (un)lucky streak.
For reference, I should say that throughout this time period I had no signs or symptoms of Sleep Apnea. Still, an average of 0.47 high EOV spikes per night could be cause for concern. If you have similar results, you might be concerned enough to consider signing up for a sleep study, which can cost thousands of dollars. However, researching the next and last section was enough to convince me not to.
The Uphill Battle
Although the EOV feature was developed in the context of Sleep Apnea, some researchers have tried to find other applications. One publication by Yamagami et al. attempted to predict exacerbation of COVID-19 symptoms by looking for EOV high spikes2. They also identified one member of their cohort who had undiagnosed severe Sleep Apnea, as they were routinely experiencing 4+ EOV high events per night. Interestingly, this patient with an AHI of 33.6 still had 9 days over a 30 day period with zero high EOV events. Oxygen desaturation is a known complication of COVID-19, but the positive predictive value of EOV high events or spikes to predict exacerbation was only 9.3% (excluding the patient with Sleep Apnea). This means that over 90% of EOV high events were not associated with COVID-19 symptom exacerbation. The authors acknowledged this limitation, recognizing that these signals can come from many sources:
High EOV signals may be invoked not only by SpO2 exacerbation but also by other situations including alcohol intake, emotional stress events, or medications, as heart rate increases in such situations.
– Yamagami et al., JMIR Form Res 2021.
Another publication conducted an investigation into measuring oxygen saturation at the arm for identifying apneas and hypopneas3. Their study found that even state-of-the-art medical devices that measure SpO2 at the arm are surprisingly poor (more than 50% of events are missed) at identifying these events compared to a fingertip sensor. The main problem is that venous blood and tissue mass can significantly impact apparent SpO2. Additionally, fingertip sensors can measure transmitted light rather than scattered light, which tends to be more accurate. Smartwatches have to contend with these issues while being confined to a small form factor, and they are prone to changing positionally on the wrist during sleep, which could change the venous and arterial blood volume that is scattering the light. Finally, there is a time-scale mismatch: the raw data from a Fitbit is in minute time resolution, and the user typically only sees 10-minute rolling averages on their plot. However, apnea and hypopnea events can be as short as 10 seconds. With the current data available, it is not possible to find individual events from Fitbit’s EOV from time resolution alone, without considering the anatomical challenges.
When companies sponsor clinical trials at the National Institutes of Health, they’re required to submit the details for record keeping in a publicly accessible database. Fitbit started their clinical trial for assessment of Sleep Apnea in November of 2018, and as of March 2024 the status is still Active, not recruiting. There have been no posted results or publications, and the estimated study completion date was nearly a year ago, on April 30th, 2023. In contrast, Fitbit’s Atrial Fibrillation detection study was launched a year and a half later in May 2020, with a publication in 2022 reporting a strong positive predictive value of 98.2%4 for their AFib detection method. The Fitbit app will now send users notifications if they detect irregular heartbeats, urging them to seek medical evaluation.
Conclusions
After researching this topic extensively, I’m convinced that Fitbit and other smartwatches are fighting an uphill battle on Sleep Apnea detection. Estimated oxygen variation was likely created as a feature to match against gold standard Sleep Apnea detection, since identifying individual events seems infeasible with a smartwatch alone. Based on the circumstantial evidence from their clinical trials and the available literature, I would hazard that they are fighting difficulties in sensitivity and specificity. In other words:
1) There are many things besides Sleep Apnea that cause high EOV spikes
2) Many people who do have Sleep Apnea will not see high EOV spikes associated with it
The patient with Sleep Apnea from Yamagami et al. stands out in my mind. Despite having severe apnea and a COVID-19 infection, roughly a third of their nights had zero high EOV spikes; surely, they experienced many apnea or hypopnea events on these nights. For the rest of the cohort, 90% of their high EOV spikes were not associated to Sleep Apnea or COVID-19 symptom exacerbation. If you have symptoms of Sleep Apnea, you should talk to your healthcare provider about it. It could change your life. For those with nothing but anxiety over the occasional orange line on a graph, I think it’s safe to rest assured.
Code
The notebook used for generating the figures can be found at: https://github.com/rlang81/blog/tree/main/fitbit-eov
References
-
Berry, R. B., Brooks, R., Gamaldo, C. E., Harding, S. M., Marcus, C., & Vaughn, B. V. (2012). The AASM manual for the scoring of sleep and associated events. Rules, Terminology and Technical Specifications, Darien, Illinois, American Academy of Sleep Medicine, 176(2012), 7. ↩
-
Yamagami, K., Nomura, A., Kometani, M., Shimojima, M., Sakata, K., Usui, S., … & Yoneda, T. (2021). Early detection of symptom exacerbation in patients with SARS-CoV-2 infection using the Fitbit Charge 3 (DEXTERITY): pilot evaluation. JMIR Formative Research, 5(9), e30819. https://doi.org10.2196/30819 ↩
-
Zhang, Z., Qi, M., Hügli, G., & Khatami, R. (2021). The Challenges and Pitfalls of Detecting Sleep Hypopnea Using a Wearable Optical Sensor: Comparative Study. Journal of medical Internet research, 23(7), e24171. https://doi.org/10.2196/24171 ↩
-
Lubitz, S. A., Faranesh, A. Z., Selvaggi, C., Atlas, S. J., McManus, D. D., Singer, D. E., Pagoto, S., McConnell, M. V., Pantelopoulos, A., & Foulkes, A. S. (2022). Detection of Atrial Fibrillation in a Large Population Using Wearable Devices: The Fitbit Heart Study. Circulation, 146(19), 1415–1424. https://doi.org/10.1161/CIRCULATIONAHA.122.060291 ↩